SAF Grand Challenge Progress Report
Progress made supporting the SAF Grand Challenge occurs when federal agencies release new funding opportunities and initiatives aligned with the SAF Grand Challenge Roadmap; provide expertise and technical assistance to industry; increase interagency collaboration; and provide data, modeling, and analysis to decision makers.
To track progress on achieving the SAF Grand Challenge goals, the following four metrics have been developed:
- Estimated total U.S. SAF production.
- Estimated life cycle CO2 equivalent reductions achieved with U.S. SAF production and use.
- Planned production potential of SAF in the United States.
- Applicable research, development, demonstration, and deployment projects.
Download the SAF Grand Challenge Progress report and fact sheet.
SAF Grand Challenge Metrics Dashboard
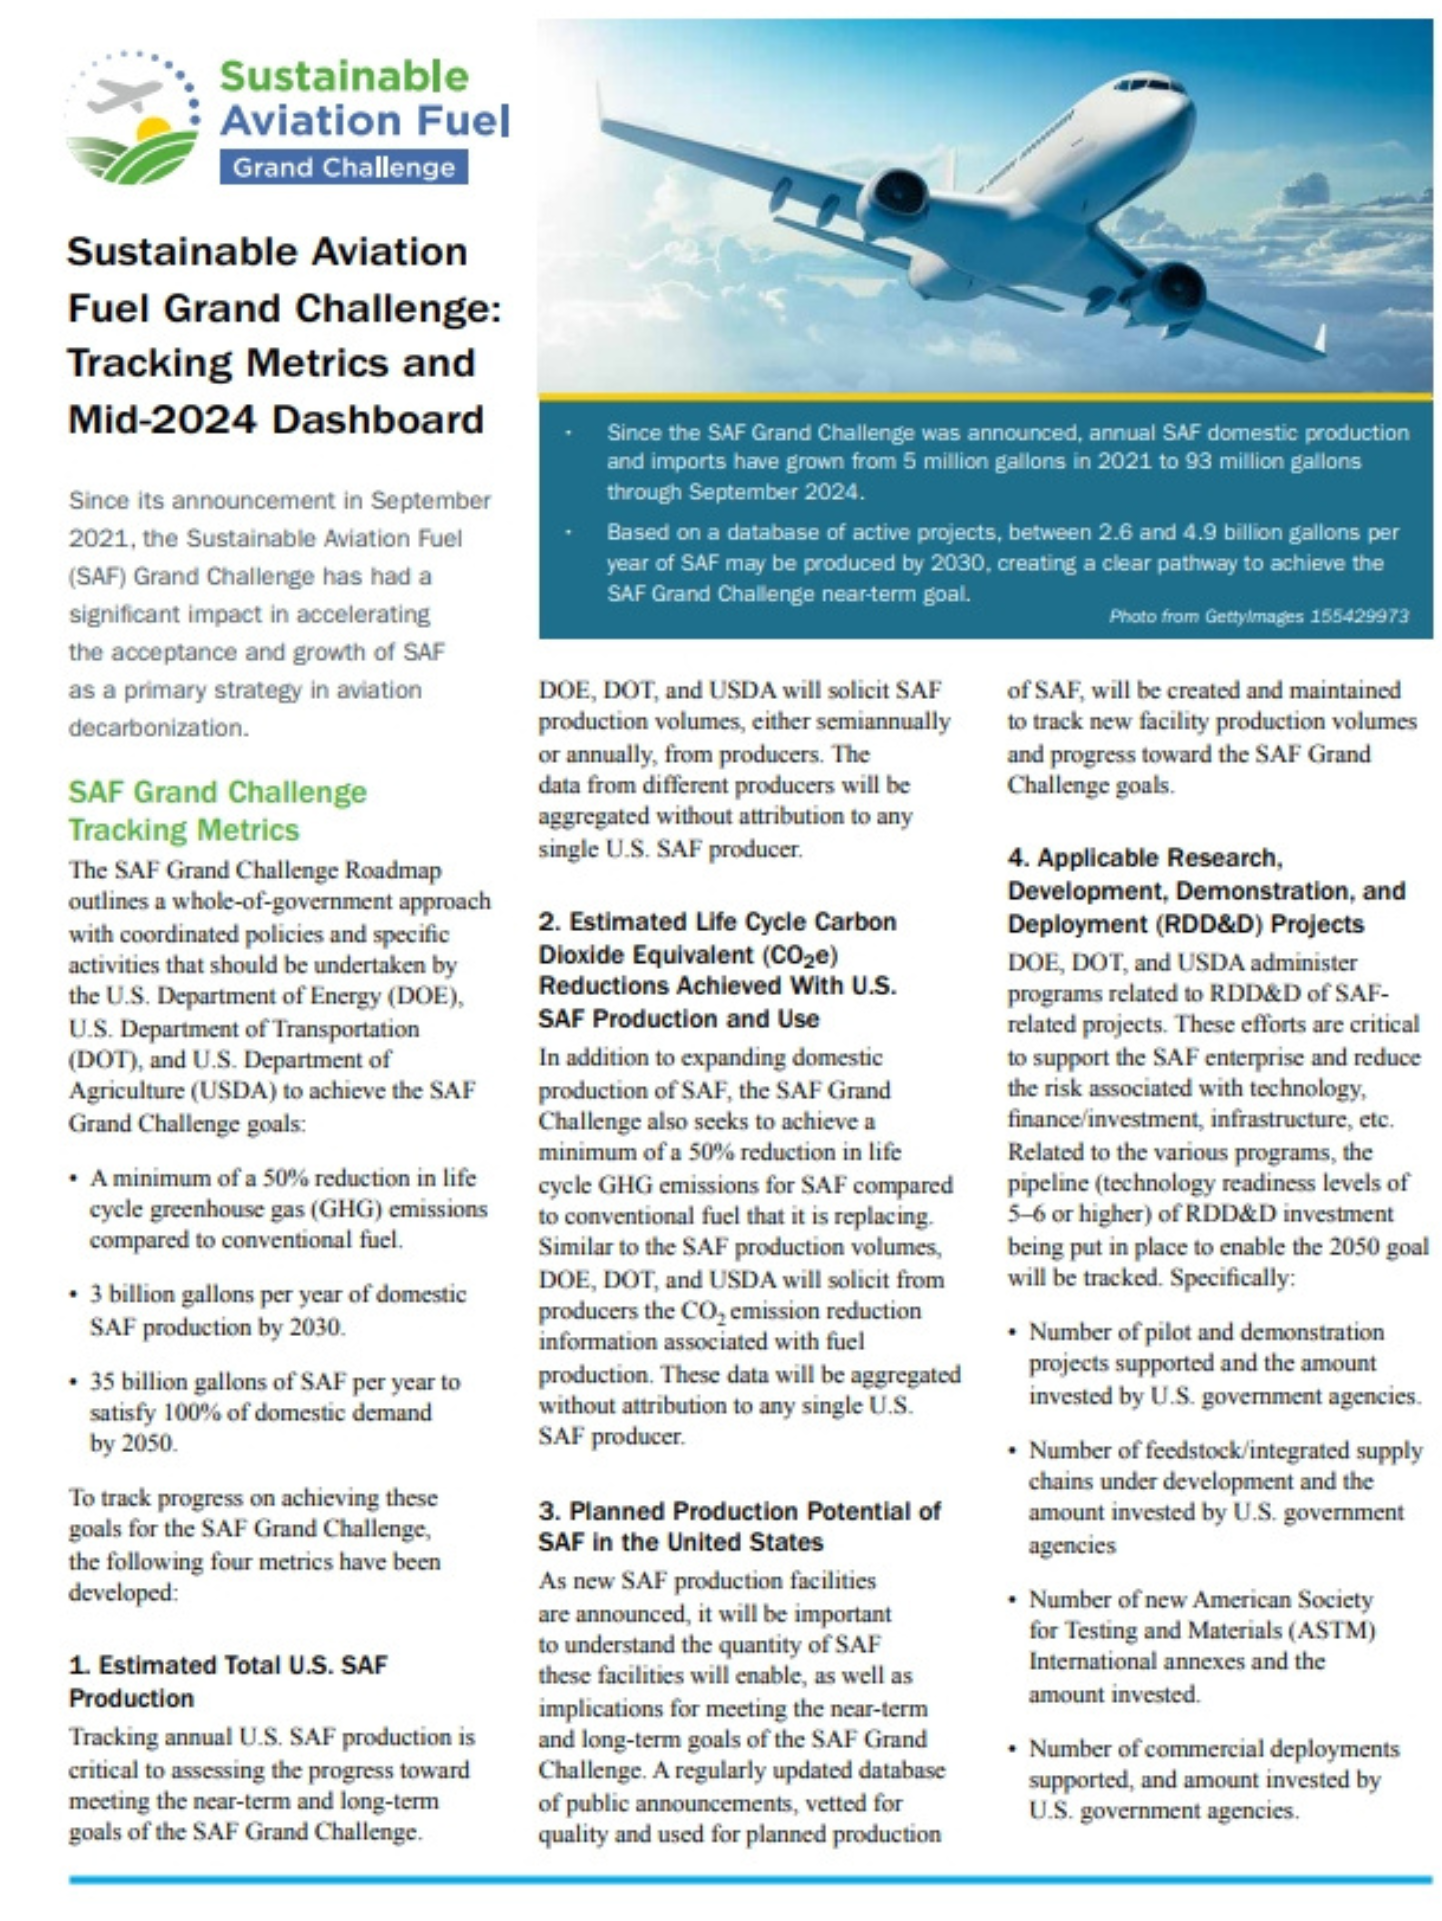
Since the SAF Grand Challenge was announced, annual SAF domestic production and imports have grown from 5 million gallons in 2021 to 93 million gallons through September 2024.
Based on a database of active projects, between 2.6 and 4.9 billion gallons per year of SAF may be produced by 2030, creating a clear pathway to achieve the SAF Grand Challenge near-term goal. More information about U.S. SAF production, annual greenhouse gas (GHG) emissions reductions from SAF, and SAF production potential is below.
Download the SAF Grand Challenge: Tracking Metrics and Mid-2024 Dashboard fact sheet.
SAF Production
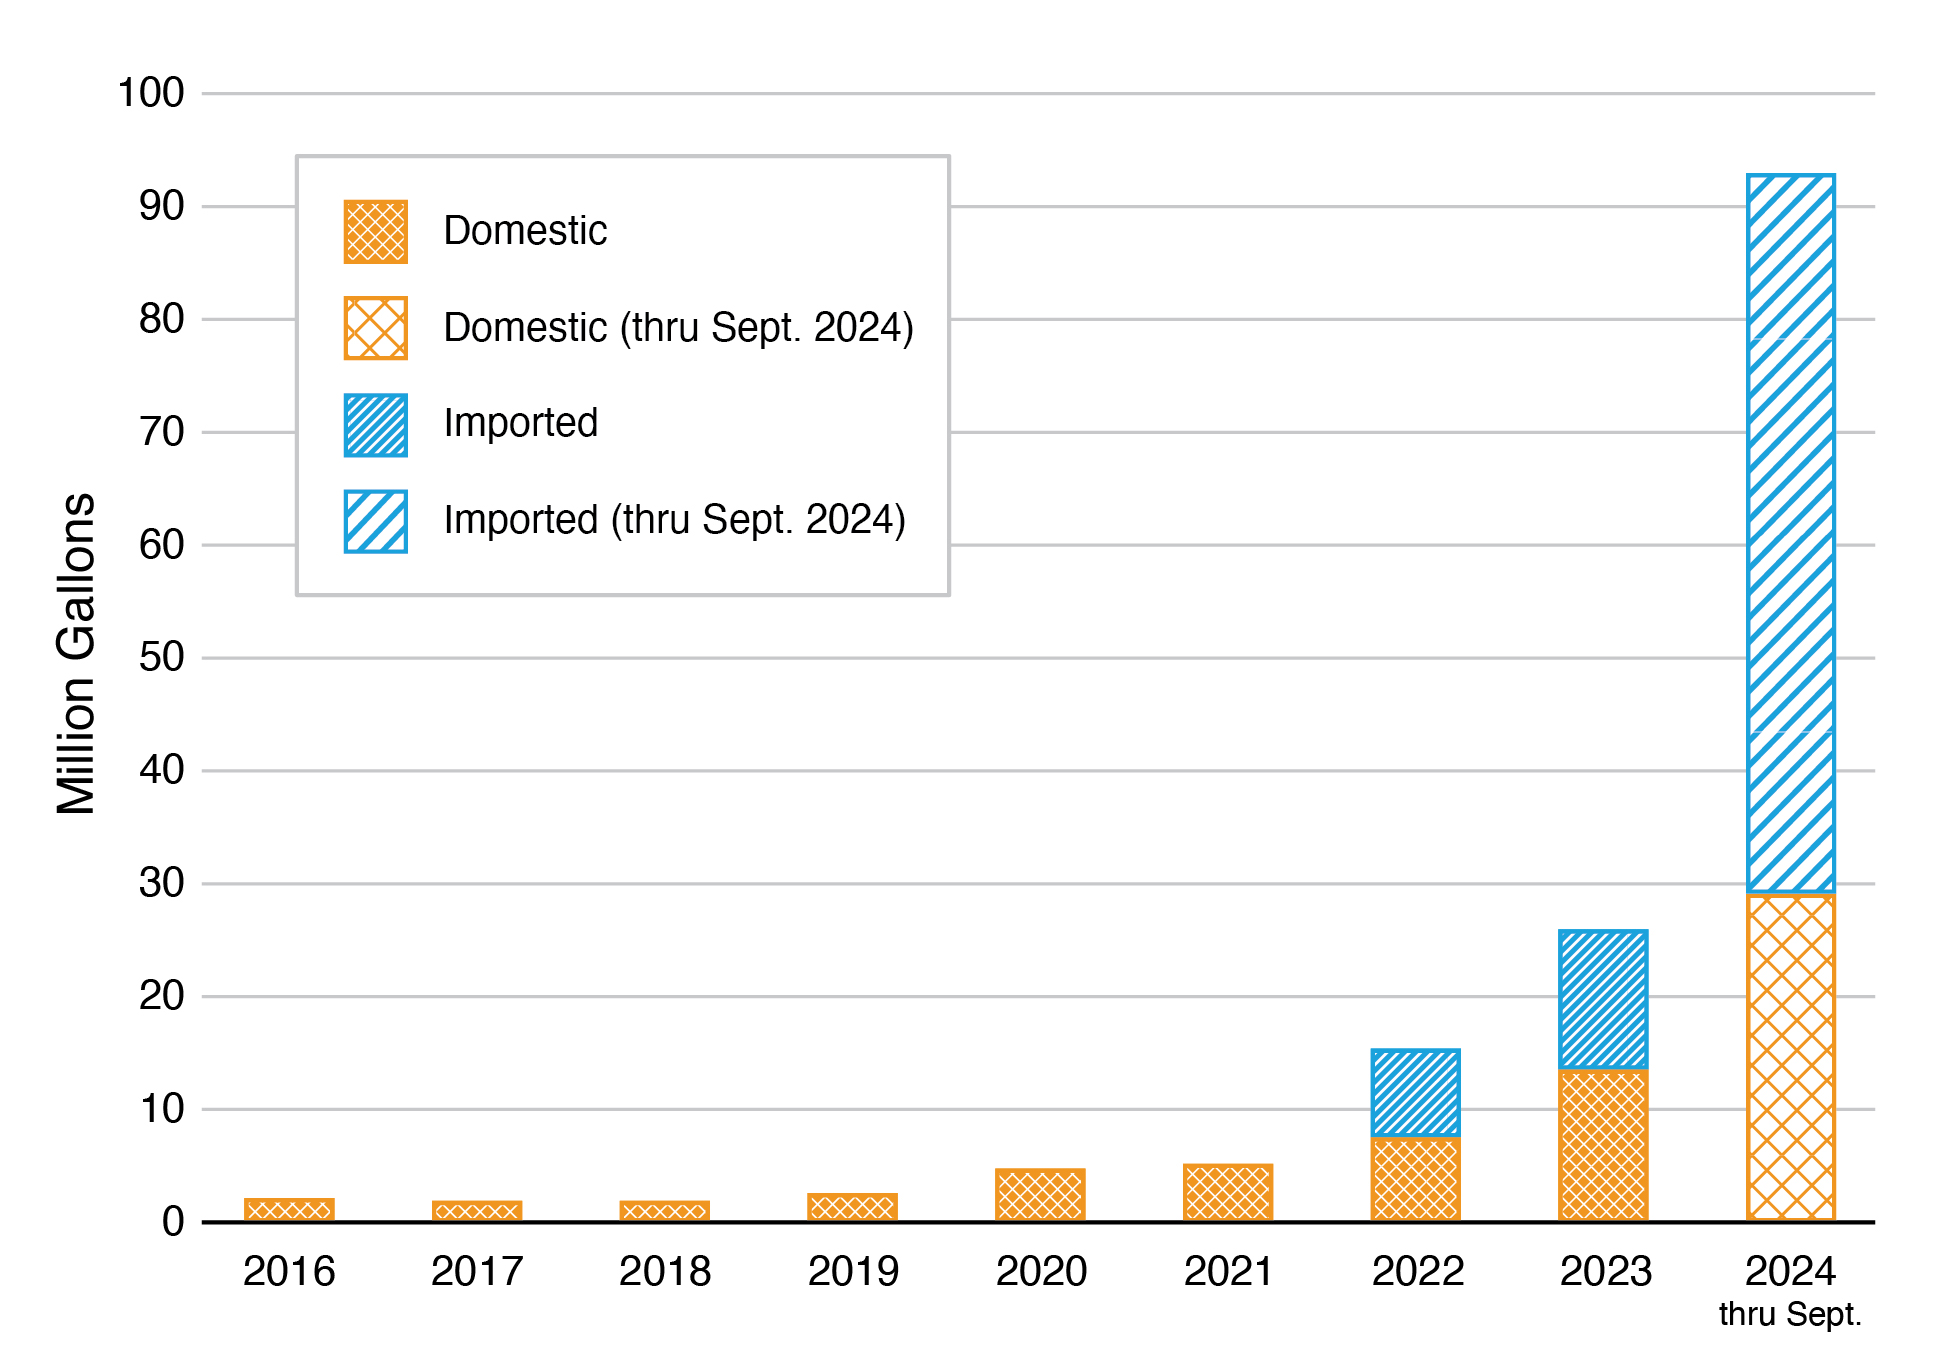
- Based on U.S. Environmental Protection Agency (EPA) Renewable Identification Number (RIN) values, SAF annual domestic production and imports grew from 5 million gallons in 2021 to 26 million gallons in 2023; 93 million gallons have been produced and imported through September 2024.a
- Through September 2024, SAF is predominantly based on conversion of fat, oil, and grease feedstocks through the hydroprocessed esters and fatty acids (HEFA) process.
- Based on public reporting, major commercial producers in this time frame include World Energy, Montana Renewables, Sinclair, and Neste Oil.
| a RIN data are currently the best available data source. |
Annual GHG Reduction
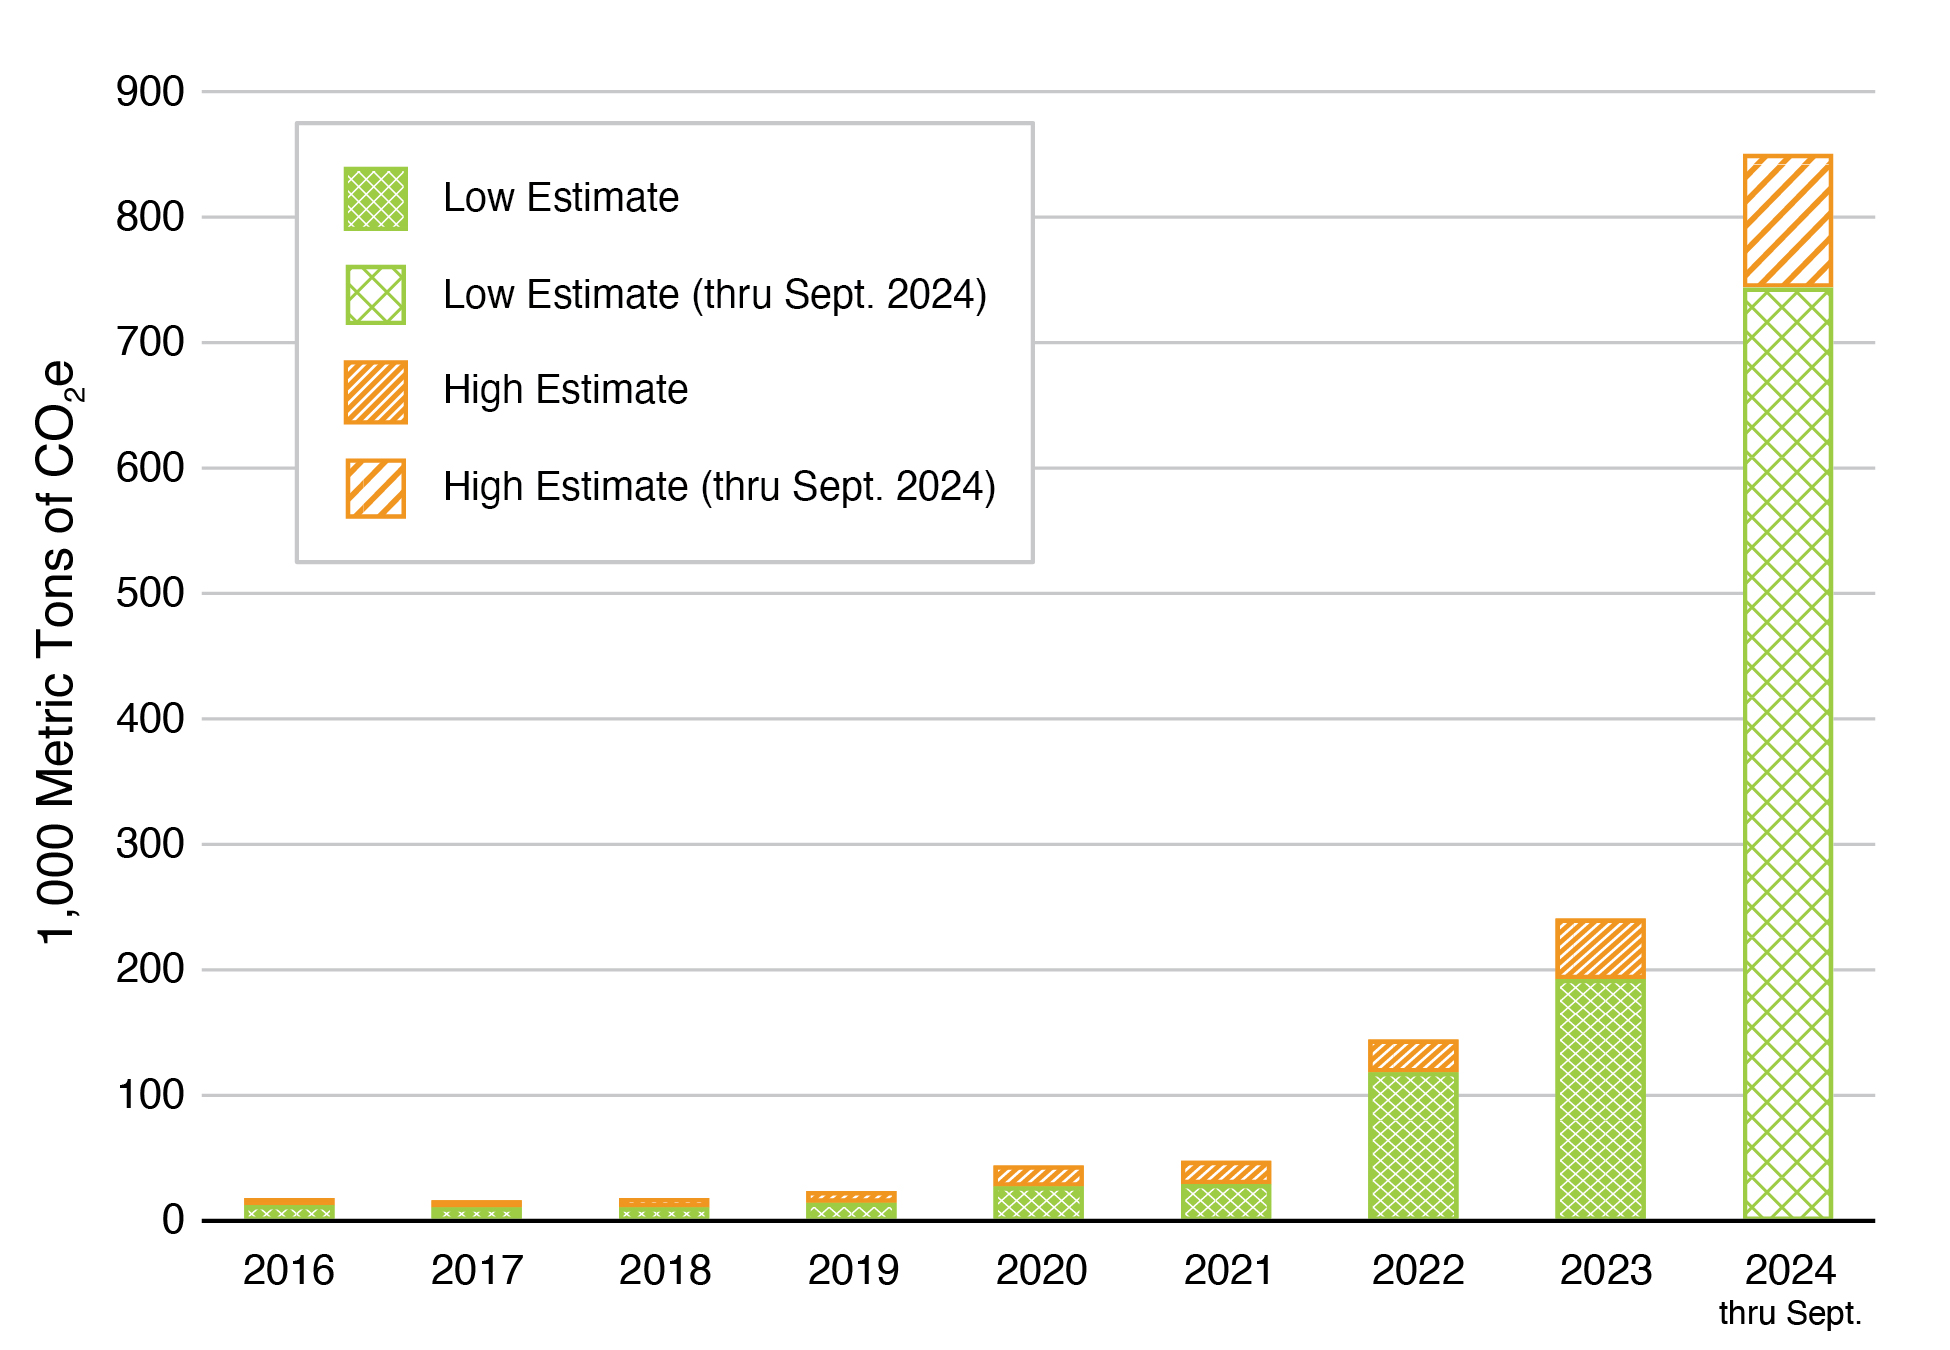
- Based on assumptions for the fat, oil, and grease feedstocks used to generate historical SAF RINs, life cycle GHG reductions range between 50% and 80% compared to conventional jet fuel.c
- For 2023, this corresponds to reductions in GHG emissions of approximately 200,000 metric tons of CO2 equivalent (CO2e).
- More than 300,000 metric tons of CO2e GHG emission reductions have been realized through September 2024.
| b Greenhouse gases, Regulated Emissions, and Energy use in Technologies (GREET®) life cycle models. https://www.energy.gov/eere/greet c Estimates of GHG emission reductions are based on the RIN volume data in the previous figure and GREET emission values. dGHG emission reductions calculated using the 40BSAF-GREET model with the sample base case input values for soybean HEFA and UCO/tallow HEFA SAF. For imported UCO/tallow HEFA SAF, a 2 g CO₂ₑ/MJ penalty was calculated using the R&D GREET model based on ocean shipping from Singapore to Los Angeles. |
SAF Production Potential
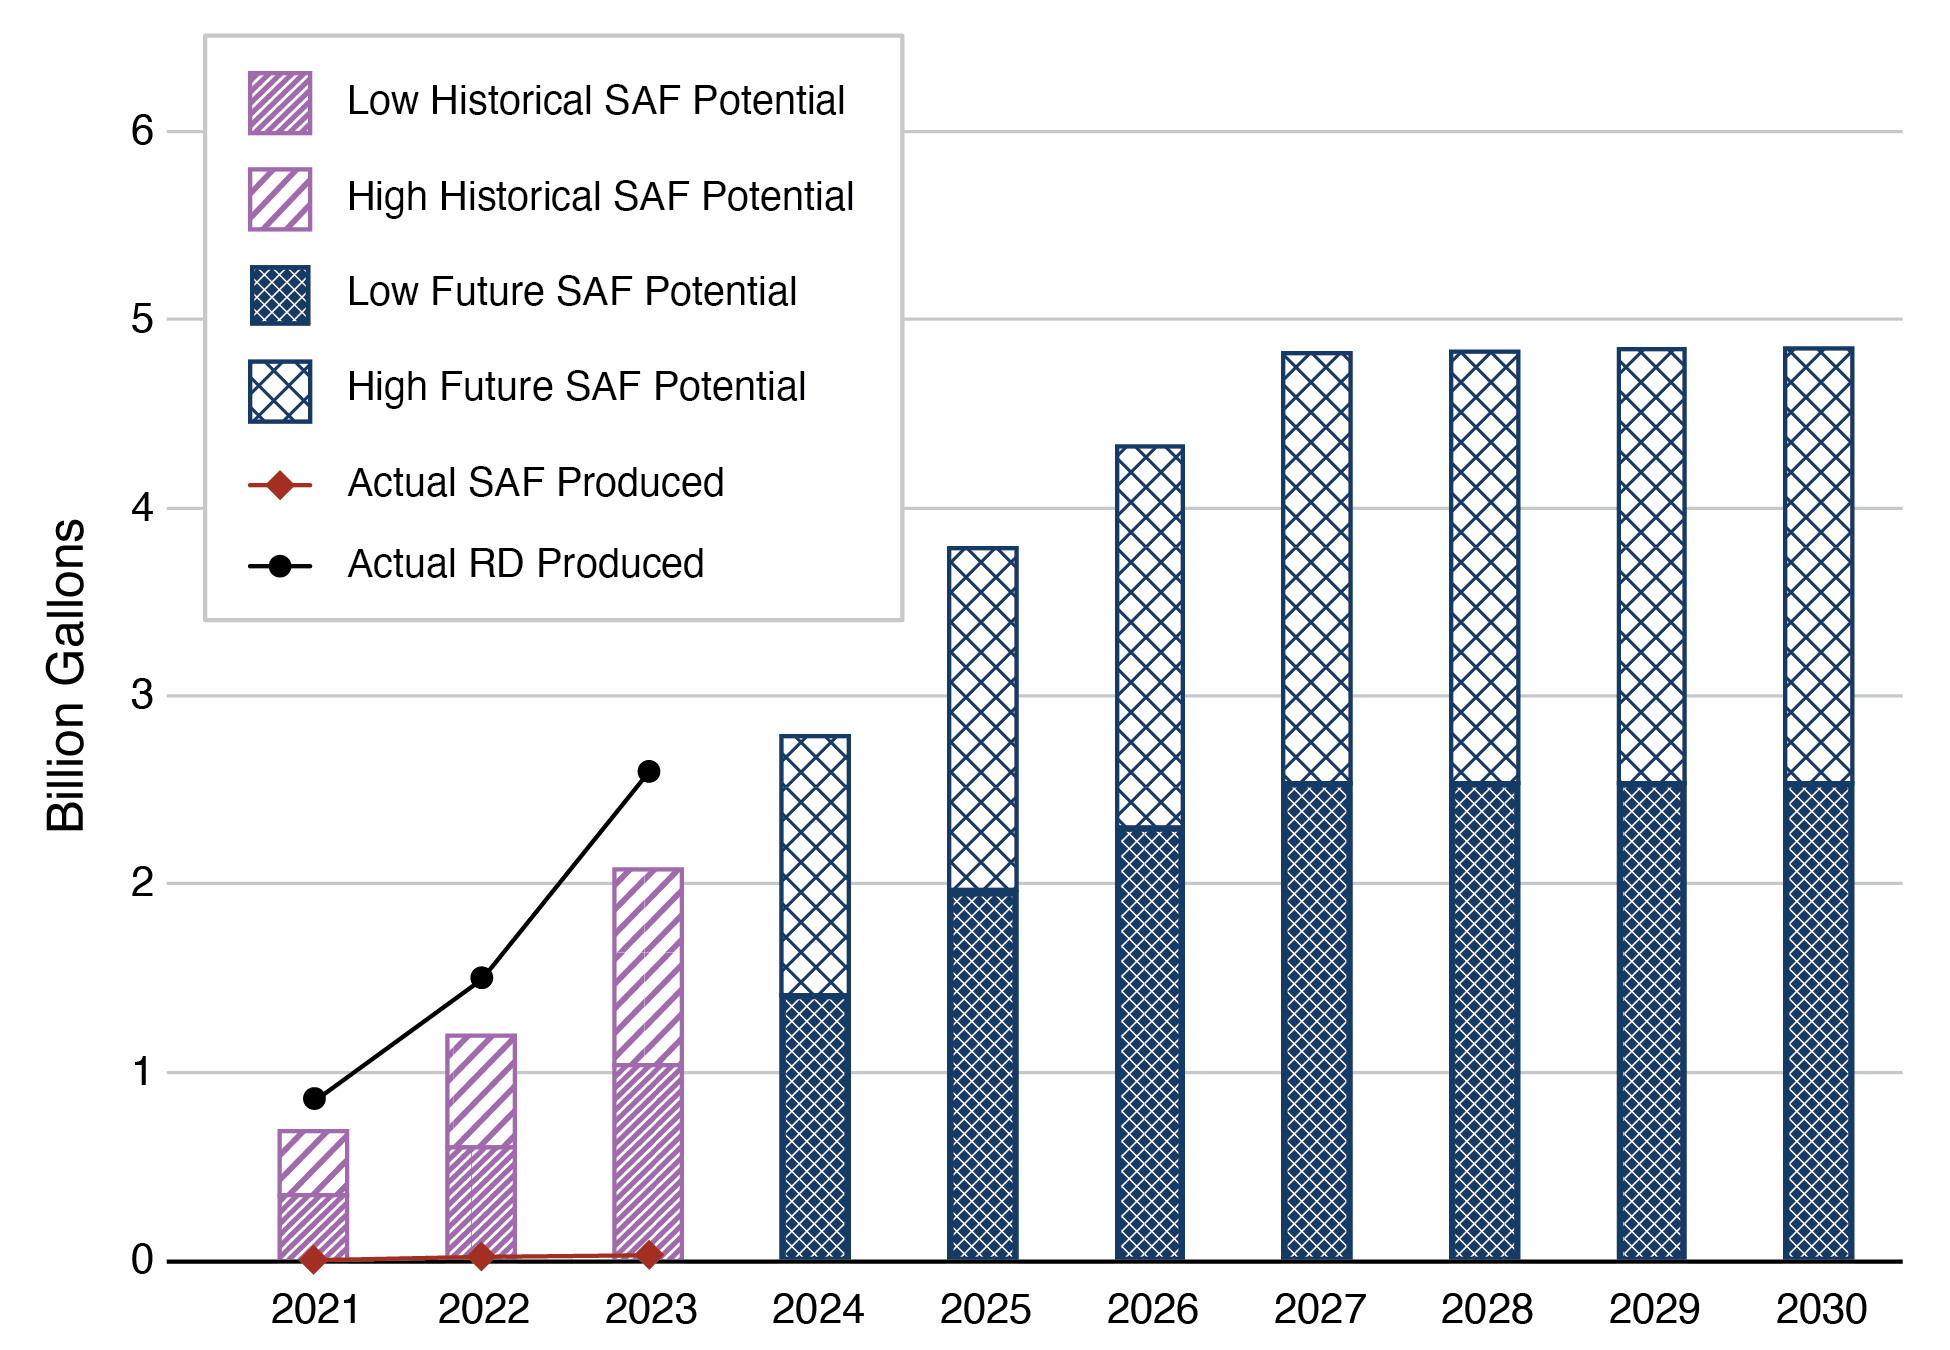
RD data source: U.S. Energy Information Administration.
SAF data source: EPA. “Public Data for the Renewable Fuel Standard.”
- Based on a database of active projects,1 between 2.6 and 4.9 billion gallons per year of SAF may be produced by 2030, creating a clear pathway to achieve the SAF Grand Challenge near-term goal.2
- This volume is predominantly renewable diesel (RD) capacity that could be shifted to SAF under favorable policy and market conditions.
- Historically, very little RD production has shifted to SAF production. The Commercial Aviation Alternative Fuels Initiative (CAAFI), a joint venture between DOT’s Federal Aviation Administration and the commercial aviation industry, is tracking more than 2 billion gallons per year of SAF production intent by the end of 2028 and is working with 200 potential SAF producers on their commercialization planning efforts.
Key Assumptions
|
|
|
1 Active projects are RD and SAF projects that are either currently producing, in construction, or announced and proceeding with development. To be included, projects must have a publicly announced start date, conversion technology, and capacity. 2 No new projects have been announced with start dates later than 2028. 3 The project success ratio, calculated from historic data, is used to estimate the number of active projects expected to successfully produce RD and/or SAF. An average project success ratio of 0.5 has been derived based on a historical database of RD and SAF projects and was applied to all active RD and SAF projects not currently in production. A project success ratio of 1.0 was applied to actively producing projects, as well as all announced coprocessing projects, as they are assumed to have a high implementation rate. 4 SAF low and high potential scenarios assume 40% and 80%, respectively, of total HEFA distillate volume redirected to SAF. |